In the realm of probability and statistics, the concept of statistical significance serves as a cornerstone for distinguishing between genuine effects and random chance. It provides a quantitative measure to support or refute the presence of an association that extends beyond the immediate data observed. P-values and confidence intervals, often misunderstood and sometimes misused, are integral tools that offer insight into the reliability of statistical findings. However, even among professionals, misconceptions about what these metrics actually convey can lead to erroneous conclusions. As we peel back the layers of complexity surrounding these concepts, we invite you to consider their profound impact on the interpretation of data across diverse fields. The subsequent discussion aims to clarify these critical statistical instruments, paving the way for a more nuanced understanding of their applications and limitations.
Key Takeaways
- Statistical significance distinguishes between genuine effects and random chance.
- P-values and confidence intervals are integral tools for assessing statistical findings.
- P-values lower than the significance level suggest inconsistency with the null hypothesis and lead to the rejection of the null hypothesis.
- Statistical significance is crucial in various fields such as clinical trials, business strategies, policymaking, and decision-making processes.
Understanding Statistical Significance
Statistical significance is a crucial concept that allows researchers to determine whether their findings are likely the result of an actual effect rather than random chance. It provides a mathematical basis for making inferences about population parameters based on sample data. When a result is statistically significant, it suggests that the observed pattern is unlikely to have occurred if the null hypothesis were true, which typically posits no effect or no difference.
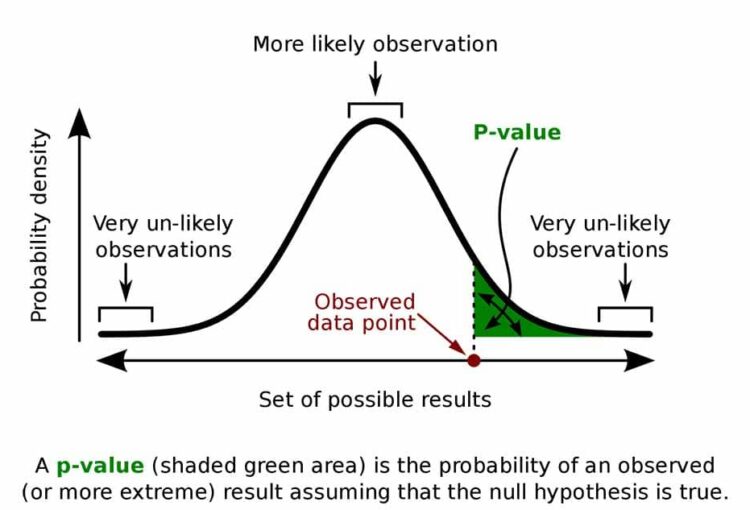
To assess statistical significance, scientists calculate a p-value, which quantifies the probability of observing results at least as extreme as those obtained, under the assumption that the null hypothesis is correct. A low p-value indicates that such an extreme result is rare if the null hypothesis were true. Conventionally, a p-value less than 0.05 is considered statistically significant, implying there is less than a 5% chance that the observed findings are due to random variation alone.
However, this threshold is not absolute and should be interpreted in context. Other factors, like the power of the test, the size of the effect, and the practical significance of the results, must also be considered. Statistical significance does not equate to practical importance; thus, results should be carefully evaluated for their real-world applicability.
Read More about: Ultimate comparison Between IB Math AA Vs Math AI
P-Values Explained

In the realm of probability and statistics, a p-value serves as a crucial index, quantifying the probability that the observed data would occur under the assumption of the null hypothesis being true. It is a pivotal element in hypothesis testing, providing a metric for evaluating evidence against a predetermined statistical model.
- Interpretation of P-values:
- Lower than the significance level (α):
- Suggests that the observed data is inconsistent with the null hypothesis.
- Leads to the rejection of the null hypothesis.
- Greater than or equal to the significance level (α):
- Indicates insufficient evidence to reject the null hypothesis.
- Does not necessarily confirm the null hypothesis is true.
The p-value itself does not measure the size of an effect or the importance of a result. It is simply a tool for decision-making in the face of uncertainty, based on a threshold set by the researcher. Typically, a p-value below 0.05 is considered statistically significant, though this standard is subject to debate and can vary by field. An analytical approach to p-values also includes considering the context of the study, the robustness of the data, and the pre-study hypotheses. Precision in interpreting p-values is essential to avoid misrepresentation of statistical findings.
Confidence Intervals Demystified
Confidence intervals provide a range of values, estimated from sample data, within which there is a specified probability that the population parameter lies. This range is calculated to express the degree of uncertainty associated with a sample estimate of a population parameter. The width of the interval reflects the precision of the estimate; narrower intervals represent more precise estimates. Typically, a 95% confidence level is used, indicating that if the same population were sampled repeatedly, 95% of the calculated intervals would be expected to include the true population parameter.
The calculation of a confidence interval incorporates the sample mean, the standard deviation, and the sample size. The standard error of the mean, derived from the standard deviation and the sample size, measures the dispersion of the sample means around the population mean. This standard error is then used to construct the interval by adding and subtracting a margin of error, which is the product of the standard error and a critical value from the t-distribution or the z-distribution, depending on sample size and whether the population standard deviation is known.
Understanding confidence intervals is crucial in hypothesis testing and decision-making processes. It allows researchers to make inferences about population parameters with an acknowledged level of uncertainty, rather than relying on point estimates alone.
You might like: What Are the Steps to Simplify Algebraic Expressions With Exponents?
Common Misconceptions
Many researchers and analysts fall prey to several misconceptions about the interpretation and significance of statistical data, which can lead to erroneous conclusions or misguided decisions. Despite the methodical rigor that defines statistical analysis, the following are prevalent misunderstandings in the field:
- Significance Equals Importance
- A statistically significant result is not inherently important or impactful. It merely indicates that the observed effect is unlikely to be due to chance alone.
- P-Value Misinterpretation
- The p-value is not the probability that the null hypothesis is true. Rather, it quantifies the probability of observing the data, or something more extreme, if the null hypothesis were true.
These misconceptions stem from a cursory engagement with statistical concepts, rather than a deep and nuanced understanding. It is crucial to recognize that statistical significance is a measure of probability, not of practical relevance or effect size. Analysts must disentangle the statistical findings from the substantive claims and consider the real-world implications of their data independently. Only through careful interpretation and application of statistical principles can we ensure that the conclusions drawn are both methodically sound and contextually relevant.
Read Also: Your Ultimate IB Math IA (Internal Assessment) Guide
Applications in Real-World Scenarios
Understanding the practical applications of statistical significance is critical for accurately interpreting data in various real-world contexts, from scientific research to business analytics. In clinical trials, statistical significance is used to ascertain whether the observed effects of a new drug are due to chance or the drug’s efficacy. Researchers employ p-values to gauge the strength of their results, ensuring that treatments are based on reliable evidence before they are approved for public use.
In the realm of business, companies rely on statistical significance to make informed decisions about marketing strategies, quality control, and customer preferences. For instance, A/B testing is a common method where two versions of a product or service are compared. Statistically significant results from such tests can lead to improvements that drive sales and enhance customer satisfaction.
Moreover, policymakers use statistical analysis to develop regulations and policies. They must differentiate between random fluctuations and significant trends in data related to economics, public health, and environmental changes. Only statistically significant findings can justify new legislation, ensuring that policy decisions are grounded in substantive evidence rather than spurious correlations.
Statistical significance, thus, is a linchpin in the validation and decision-making processes across sectors, emphasizing the importance of rigorous data analysis in shaping advancements and policies.
Frequently Asked Questions
How Does Statistical Significance Relate to Practical Significance in Real-World Decision-Making?
Statistical significance is a mathematical determination of the likelihood that a relationship between variables is due to chance. In real-world decision-making, however, practical significance takes precedence, assessing the actual impact or effect size of the findings. While statistical significance can support the validity of a result, it does not inherently imply a meaningful or beneficial outcome, necessitating a careful evaluation of the practical implications for informed decision-making processes.
Are There Alternative Methods to P-Value for Determining Statistical Significance, and How Do They Compare?
Alternative methods to the p-value for determining statistical significance include Bayes Factors, likelihood ratios, and confidence intervals. These techniques offer different perspectives on data analysis, with Bayes Factors allowing for prior information integration, likelihood ratios comparing competing hypotheses, and confidence intervals providing an estimate range. Each method has distinct advantages and implications, and their utility may vary depending on the research context and the specific questions being addressed.
How Should One Adjust the Level of Significance When Conducting Multiple Comparisons or Tests?
When conducting multiple comparisons or tests, adjusting the level of significance is crucial to control the false positive rate. Techniques such as the Bonferroni correction or the False Discovery Rate (FDR) approach are commonly applied. The Bonferroni method is conservative, reducing the alpha value by the number of tests, whereas FDR controls the expected proportion of incorrect rejections. The choice of method depends on the balance between type I error rate and statistical power.
What Role Does the Power of a Statistical Test Play in the Context of Statistical Significance, and How Is It Calculated?
The power of a statistical test is fundamental in determining the likelihood that the test will reject a false null hypothesis. It is calculated by considering the sample size, effect size, significance level, and the statistical distribution. A higher power indicates a greater probability of detecting an effect, if one exists, thereby reducing the risk of a Type II error, which is failing to observe a difference when one is truly present.
Can Statistical Significance Be Affected by the Sample Size, and if So, How Should Researchers Approach Sample Size Determination to Ensure Accurate Results?
Statistical significance is indeed influenced by sample size. Larger samples generally lead to more precise estimates of the population parameter, thereby increasing the likelihood of detecting true effects. Researchers must approach sample size determination meticulously, considering the expected effect size, desired power, and acceptable alpha level. Appropriate sample size calculation is critical to avoid type I and type II errors, ensuring the reliability and validity of the study’s conclusions.
Conclusion
In conclusion, statistical significance plays a pivotal role in the interpretation of data within probability and statistics. A comprehensive understanding of p-values and confidence intervals is essential for accurate analysis, while awareness of common misconceptions prevents misinterpretation of results. The application of these concepts in real-world scenarios underscores their importance in guiding informed decision-making. Through meticulous analysis, statistical significance acts as a cornerstone for validating research findings and advancing empirical knowledge.
